Community analytics: The complete guide to measuring what matters
Think of a community like an iceberg—most of the action happens beneath the surface.
It's easy to get caught up in the stuff you can see, such as the comments, likes, and posts—just like on social media. But that's just the tip of the iceberg.
Community analytics give you a deep, objective, complete look into where, when, and how your members are engaging—and how truly “healthy” your community is. It’s a true under-the-hood (or underwater, if we’re still going with the iceberg analogy) view into how your community is performing. From here, you can assess what’s working and what’s not, so you can figure out where you want to go and build a plan to get there.
That’s not to say you want to abandon your intuition. But the best community strategies come when data and gut instincts work together. That’s when the real magic happens.

In this guide, we’ll go beyond the basics. You’ll learn how to measure what matters—at every stage of your community’s growth, across every layer of engagement and business impact.
The importance of community analytics
As a community builder, you can usually feel when something’s off. Maybe it’s:
- Fewer posts by members
- Comment sections going quiet
- Previously active members drifting away or disengaging
You can sense the shift—but without data, it’s hard to trust your instincts, let alone figure out how to fix it. That’s your cue to tap into community analytics—data points that help pinpoint what’s not quite working in your space.
But before we get into why analytics matter so much, let’s make sure we’re all speaking the same language. What exactly do we mean by analytics, metrics, KPIs, and all the other terms that get thrown around?
Quick definitions
- Community analytics: The overall process of collecting, interpreting, and applying data about your community. It includes both quantitative data (like login frequency) and qualitative data (like sentiment or feedback).
- Community metrics: Metrics are the specific data points you track—things like monthly active users (MAU), churn rate, or the number of posts per member. They tell you what’s happening, but not always why.
- KPIs (Key Performance Indicators): The specific metrics that matter most to your goals. These are your success markers, like retention rate or conversion from free to paid membership.
- Benchmarks: Standard performance levels used for comparison either against your past performance or industry averages. They help you understand whether your numbers are strong, average, or need improvement.
Why tracking community metrics matters
Building a successful community takes more than good vibes—it takes good data. Knowing your numbers helps you plug the leaky bucket before you drown in it.
Here’s why metrics deserve a front-row seat from day one.
↪️ Helps guide strategy (not just report performance)
On the surface, metrics reveal the current standing of your community. However, when you go deeper, these same metrics become decision-making tools that shape your broader strategy.
They help you identify systemic gaps, such as weak onboarding, declining engagement, or low conversion from free to paid members, and prioritize the right initiatives to address them.
So, instead of reacting to surface-level issues, you’re solving root problems and setting your community up for aligned, long-term business growth.
We’ve seen this firsthand. At Circle, we don’t just build community tools—we run our own vibrant community for creators. Which means we’re always testing, tweaking, and learning from the inside.
“One experiment we ran at Circle was overhauling our onboarding experience to activate new members faster and better.
The results? Completion rates jumped from around 3% to 9%, and new member posts increased by 20%. Around the same time, we also introduced gamification features—and across the board, our metrics saw a 20%+ lift. Small optimizations like this (driven by the right metrics) can lead to meaningful gains for your community.”
— Pedro Hernandes, Circle’s Community Manager
↪️ Aligns community goals with business outcomes
Speaking of goals, for the community to deliver real impact, it also has to tie back to the bigger business outcomes. Things like:
- Customer retention
- Product adoption
- Recurring revenue
The right metrics help you show how your community drives meaningful results across business-important metrics, not just surface-level activity. When asked how important it is to align community goals with business outcomes, Ashley Gore, a strategist for community founders, put it this way:
“I do feel this depends on your business model. If community is a large portion of your business and revenue, it’s crucial. It amazes me how many community founders I’ve talked to who answer ‘What is your average churn?’ with ‘I don’t know.’
You have to be focusing on more than just bringing people in. Delighting them with opportunities to engage and retaining them is even more important than bringing in new members.”
— Ashley Gore, a strategist for community founders and an online course creator
↪️ Enables data-driven decisions for growth and retention
Communities grow stronger when decisions are backed by real insight. From identifying which members are at risk of churning to spotting your most active advocates, your data helps you take action where it matters most.
In other words, it allows you to prioritize resources, personalize outreach, and improve the member experience at scale.
Happier members = higher lifetime value
And it all starts with tracking the right metrics.
The top 5 community metrics you need to track
By now, you know that your analytics tracking strategy should evolve as your community grows. But some metrics are so foundational, so universally useful, that they’re worth tracking no matter what stage you’re in. Let’s look together at what they are 👀
1. Monthly active users (MAU)
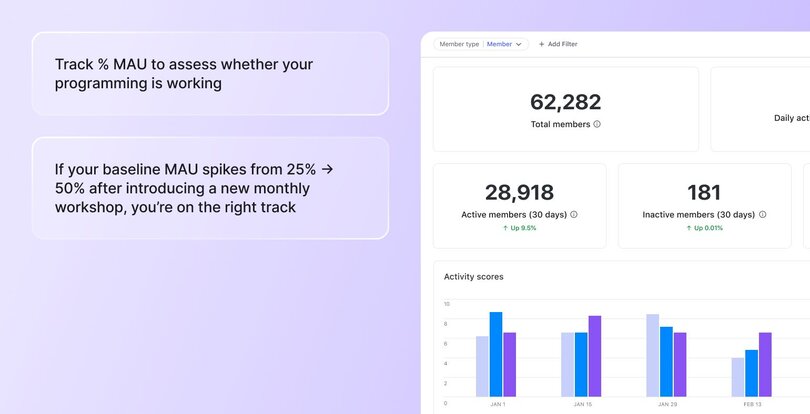
What it is: The number of unique members who logged into your community at least once during a given month. To get a more accurate sense of engagement, it’s helpful to look at % MAU—what portion of your total members are active in a given month.
Why it matters: A high % MAU means you’re delivering regular, recurring value that brings your members back into the community again and again (and again!). In Circle’s 2025 Community Trends Report, 75% of community managers said they track total active members more than any other metric. It’s become the clearest indicator of whether your community is actually working.
What good looks like: It depends a little on how many members you have. Larger communities will almost always have a lower % MAU, even though they have more active members overall.
We looked at 16,000+ active Circle communities, and these are their median MAU rates:
- Small communities (<50 members) ~54% MAU
- Medium communities (51-500 members) ~38% MAU
- Large communities (>500 members) ~20% MAU
Want to go one step further? Consider tracking stickiness—the percentage of monthly active users who return daily.
Tom Ross, a community-building coach, says: “I love seeing MUA and DUA. I combine these to create a ‘stickiness figure’ (DUA as a % of MUA). I believe I learned this from David Spinks, but it’s a helpful metric.”
2. % of posts created by members
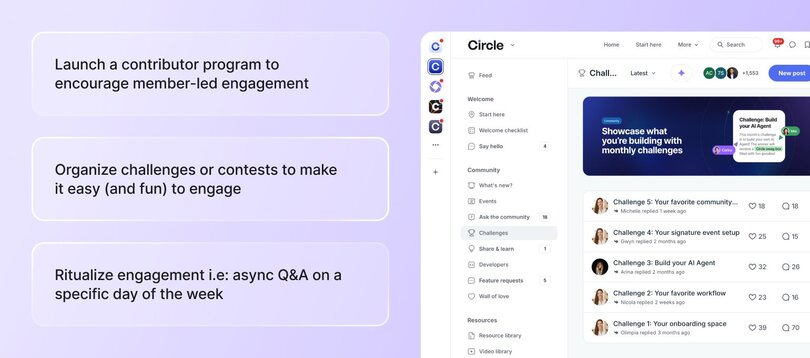
What it is: The percentage of total community posts created by members (not admins or moderators). This helps you understand how much of the conversation is being driven by your community versus your team.
Why it matters: This metric tells you how self-sustaining your community is. If members are regularly starting discussions, asking questions, or sharing insights without being prompted, that’s a strong sign of ownership and long-term value. In thriving communities, members don’t just consume—they contribute.
What good looks like: A strong benchmark is around 60-80% (which means four out of every five posts are created by members, not admins), but it also deeply depends on the size of your community. An average number of member-created posts in Circle communities this year is:
- Small communities (< 50 members) - 20%
- Medium communities (51-500 members) - 46%
- Large communities (> 500 members) - 74%
3. Monthly recurring revenue (MRR)
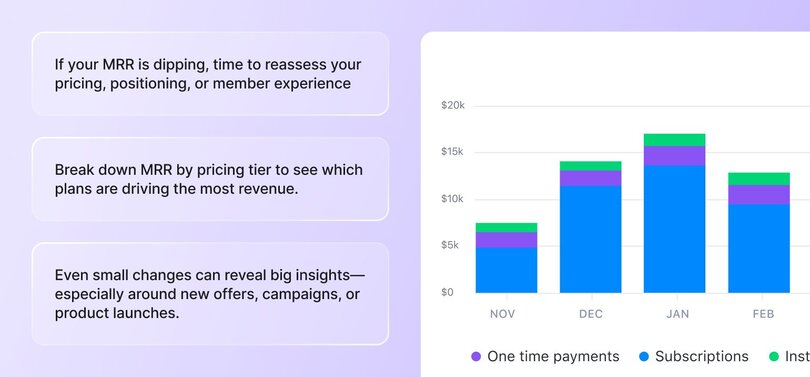
What it is: The amount of recurring subscription revenue you expect to earn each month from paying members. It’s based on your current member count and pricing tiers.
Why it matters: MRR gives you a clear sense of your community’s financial health. It reflects how well you're acquiring and retaining members, and whether your offer is compelling enough to sustain and grow revenue over time. It’s also a leading indicator of whether your community pricing and packaging are working.
What good looks like: There's no universal benchmark here—it depends on your business model, niche, and goals. What matters most is whether your MRR is stable or growing month-over-month.
👉🏼 If you want to see how your current audience (social and email) could convert into recurring revenue via a paid community, check out our free Community ROI Calculator.
4. Event attendance rate
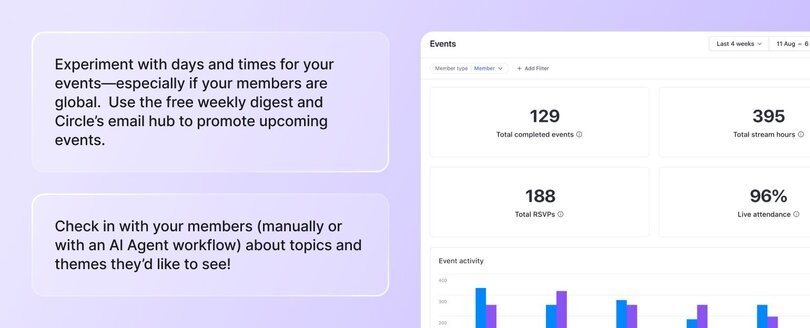
What it is: The percentage of RSVPs who actually attend your community events. It shows how well you’re converting interest into participation.
Why it matters: This metric helps you gauge both interest and execution. If your attendance rate is low, it may signal that your topics aren’t resonating, your reminders aren’t landing, or your timing is off. High attendance, on the other hand, suggests strong alignment between your content and what your members value.
What good looks like: A solid event attendance benchmark from top Circle communities is 50% or higher. If you're consistently seeing below 30% attendance, it’s worth re-evaluating your event format, content, or promotional strategy. Find clues in your data to figure out how you could improve your event strategy.
5. Churn
What it is: Churn is the number of canceled subscriptions divided by active subscriptions. It tells you how good of a job you’re doing at delivering continuous value that retains members.
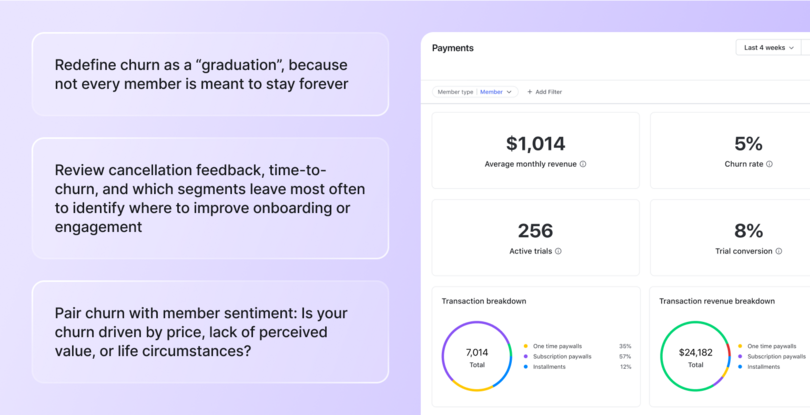
How to interpret it: Churn isn’t always bad. Some churn can even be a good thing! We’ve heard community builders reframe it as a ‘graduation’ or ‘celebration’ because a member got the skills and support they needed to move on to their next chapter.
What best in class looks like: As Tom Ross, founder of Learn Community and Circle expert, puts it, “Churn is a topic that can cause a lot of anxiety and frustration for community builders.”
It’s also something that can be affected by a multitude of factors, including: the size and age of your community, if it’s free or paid (and what the price is), the value proposition, and much more.
But here are some ballpark churn benchmarks:
- <2.5%: Unbelievably good
- 5%: Really excellent
- 10%: Average
- 15–20%+: On the higher side, work to be done
Note: Smaller communities tend to have slightly higher churn rates than medium-large ones. The good news? The average churn rate for Circle communities is anywhere between 4.9%-7.4%—much better than industry averages.
The Community Analytics Maturity Model 👇
What you measure will depend a lot on the stage your community is in. Tracking everything from day one isn’t a great idea. Too much data too early in your journey can lead to overwhelm and analysis paralysis.
Instead, think of your analytics as something that evolves over time. As your community grows, so does the complexity of your metrics. Some data points (like churn or engagement rate) remain important at every stage, while others become relevant as your goals and operations expand.
The key is knowing which metrics to prioritize now—and which ones to layer in as you scale. Use the Community Analytics Maturity Model for guidance👇
| Stage | Primary focus | Core metrics to track |
|---|---|---|
| Beginner | Get people in the door and make sure they’re engaging early | - Monthly active users (MAU) - Membership growth rate - New members vs. churn - Onboarding completion rate - % posts by members - Retention rate |
| Scaling | Strengthen participation and start linking behavior to long-term value | - Engagement rate - Posts and comments per member - Event participation rate - Churn rate - Response time and rate - Cohort retention rate |
| Advanced | Optimize for business impact and use data to shape long-term strategy | - Revenue attribution - Conversion rate - Customer support deflection rate - Product feedback volume - Sentiment score |
✨ Circle makes tracking engagement metrics easier with an Activity Score for each member—a 1–10 rating that combines presence, participation, contribution, and connection. It gives you instant insight into who’s thriving and who could use a little nudge.

Other community metrics that help you measure what matters
Right, let’s go a bit deeper now at the community metrics you should be tracking to gauge how different aspects of your community are performing.
To measure community growth
These are the core metrics to track when your primary goal is growing your member base and understanding who’s joining.
- Membership growth rate: Tracks how fast your community is growing. Useful for setting monthly or quarterly growth goals.
- Churn rate: Shows how many members are leaving over a set period. High churn can signal deeper issues with value or engagement.
- New members vs. churn: Compares how many people you’re adding versus how many are leaving. A quick way to check if your business is growing or just replacing lost members.
- Member demographics: Gives insight into who’s joining, like age, location, interests, or profession. Useful for tailoring content and outreach—and identifying your ideal member
- Retention rate: Tells you how well you’re keeping members over time. High retention often signals strong onboarding and ongoing value.
📘 Want a simple way to assess your community’s health? Check out our community assessment guide for a helpful framework.
To measure participation and engagement
Once you’ve got members joining, the next question is: are they actually participating? Engagement metrics help you understand how active your community is.
- Active members: Tracks how many members are active on a daily (DAU), weekly (WAU), or monthly (MAU) basis. These metrics help you understand both the frequency and consistency of member engagement across different timeframes.
- Engagement rate: Measures how many members are participating (liking, posting, commenting) relative to your total member base. Useful for spotting dips or momentum.
- Posts and comments per member: Shows how much conversation is happening per person. High numbers often point to a lively, member-led space.
- Event participation rate: Tells you how many members are attending events compared to those invited. A good indicator of topic relevance and community buy-in.
- Response time and rate: Measures how quickly questions or posts get replies—and how often they do. Critical for creating a sense of responsiveness and trust, especially in customer or support communities.
- Courses started: Tracks how many members begin a course or structured learning path.
To measure content and discussion value
Engagement alone doesn’t tell the whole story. You also want to understand the quality of what’s happening in your community. The following metrics help you do just that.
- Content engagement metrics: Includes things like views, clicks, likes, or reactions to show how members interact with content. Helpful for understanding what content formats and topics resonate most—but should be looked at in a broader context to avoid simplification.
- User-generated content metrics: Measures how much of your community content is created by members versus you/your team. When members are creating content on their own, it means they see the community as a place worth investing in—not just consuming.
- Discussion quality metrics: Assesses the depth and usefulness of conversations, often through scoring or tags. Reveals whether members are sharing meaningful insights or just surface chatter.
- Sentiment analysis: Gauges the emotional tone of conversations to spot hidden friction or celebrate positive momentum. With Circle’s AI agents, you can surface these insights automatically, making it easier to understand how your members are really feeling.
- Knowledge sharing metrics: Tracks how often members ask questions, provide answers, or share resources. A strong indicator that your community is becoming a trusted hub for support and learning. In Circle, you can track these metrics through two separate spaces, like “Ask the Community” for questions and “Share a Win” for expert insights, making it easier to see how knowledge flows in your community.
To understand business impact and ROI
As your community matures, you’ll need to go beyond engagement and start proving how your efforts contribute to the business. These metrics connect member activity to outcomes like revenue, retention, and new product development.
- Conversion rate: Tracks how many community members take a specific action, like upgrading, buying, or signing up. A direct indicator of how your community drives business goals.
- Customer support deflection: Measures how many questions are answered by members (or AI agents) instead of your support team. With strong peer-to-peer support, you’re able to save on customer support costs. As an example, the Circle customer community’s AI agent has helped answer 62% of basic product questions–and keep conversations in the actual community more focused on strategic community-building.
- Retention impact: Looks at whether community participation correlates with higher customer retention. Shows how community engagement can increase lifetime value.
- Product feedback implementation: Tracks how often feedback from community members influences product updates or features. On Circle, we have a dedicated Feature Requests space where members can share ideas and upvote suggestions. Since launch, we’ve implemented over 200 community-requested features.
- Revenue attribution: Measures how much revenue can be tied back to community touchpoints, such as events, content, or discussions. Circle allows you to see which courses and offers are generating the most revenue, which paywalls are performing best, and how your revenue is distributed across subscriptions, one-time payments, and payment plans.
Advanced analytics to measure the future of your community
Once you’ve nailed the basics, these advanced metrics can help you anticipate trends, improve the member experience, and build for long-term growth.
- Predictive analytics: Uses historical community data like activity trends, churn patterns, or engagement drop-offs to forecast future outcomes. For example, it can help you identify which members are at risk of leaving. On Circle, you can use filters like “Last logged in >30 days” to identify at-risk members and proactively reach out or trigger a re-engagement workflow.
- Cohort analysis: Groups members based on when they joined or a shared behavior, then compares how those groups engage over time. For instance, you might look at how January joiners compare to March joiners in terms of retention or post activity. It helps you see what’s working (or not) across different cohorts. With Circle’s analytics filters, you can compare engagement levels across different cohorts as well!
- Journey mapping metrics: Tracks the different paths members take from signup to superfan. Helps you spot where people drop off or get stuck so you can optimize their experience. On Circle, you can use automations to add tags by members as they complete key actions, like opening a welcome email or joining an event, and then use those tags in analytics to spot where people drop off. You can also monitor drip campaigns to see which emails aren’t opened or clicked, helping you pinpoint and fix friction points.
- Custom scoring systems: Combines multiple behaviors (like logins, posts, comments, or purchases) into a single score to assess member engagement or value. Useful for segmenting your audience into active, at-risk, or high-potential groups, especially helpful for prioritizing outreach or rewards. Again, this is where you can use Circle’s filters, like combining high scores with last logged in < 7 days, and above certain level to invite the best members to engage in challenges.
Setting strategic goals and community KPIs
Tracking metrics is only useful if you know what success looks like. This section walks you through how to set clear goals, organize your data, and use your insights to drive real improvements in your community.
Setting SMART goals
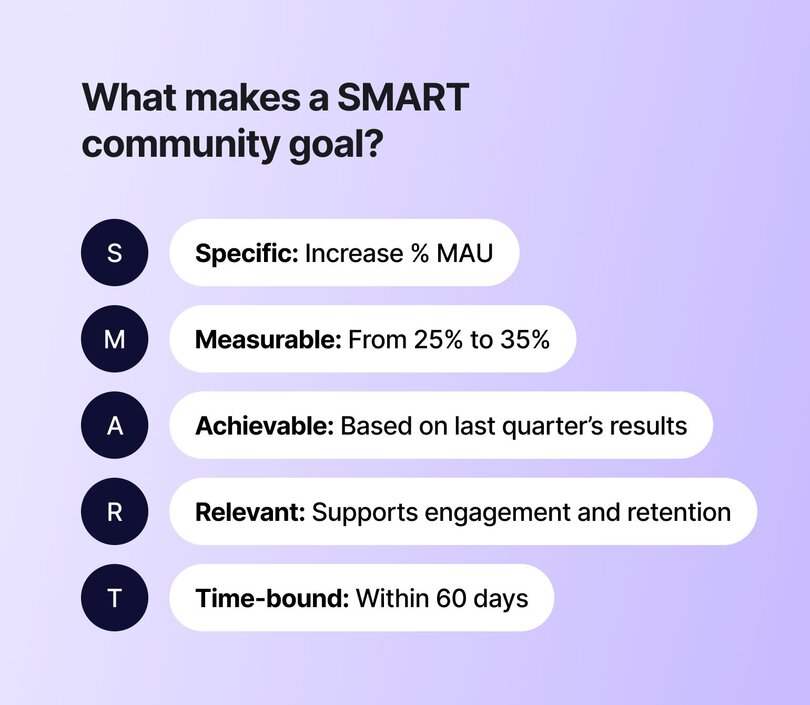
SMART goals are a tried-and-true framework that makes your objectives easier to plan, measure, and actually hit. A vague goal like “increase engagement” becomes far more useful when it’s rewritten as “increase % MAU from 25% to 35% over the next 60 days through new member campaigns.”
Setting goals this way helps you stay focused, communicate clearly, and build experiments with a finish line.
Creating dashboards
You should also set up a dashboard to pull together all the key data from your community. It can be as simple as a spreadsheet or a Notion doc. But if you want to future-proof things, it’s worth investing in a platform like Circle that provides you with built-in analytics right at your fingertips. It’ll save you from manually piecing data together from multiple tools.
Reporting to stakeholders
Whether you’re co-running a community with a business partner or managing one within a larger organization, having clear, reliable data is essential. You may need to sunset initiatives that aren’t delivering results, or advocate for more resources, staffing, or strategic shifts to support what is. In either case, regular reporting backed by solid metrics is what enables informed decisions, alignment, and ongoing support from stakeholders.
“At Circle, every month, we share a report across teams that includes community engagement, feature feedback, and growth trends linked to customer retention and sales. This report helps align feedback we can get from our community with Product, Customer Success, and Marketing, and helps us build an even better product.”
— Pedro Hernandes, Circle’s Community Manager
How to improve your community metrics
Got your metrics in place? Great. Now it’s time to address the areas that need attention. Here’s what to do in four common scenarios👇
If your MAU is lower than you'd like…
Focus on proper onboarding and re-engagement. Often, members aren’t inactive because they don’t care—they’re just not clear on what to do next. A simple onboarding flow with welcome emails, DM nudges, or “start here” guides can make a huge difference. You can also run a weekly roundup or member digest (created for you automatically in Circle!) to pull people back in—or start building up your event programming!
If your churn rate is creeping up…
It’s time for more personal connection and feedback loops. High churn usually means that somewhere along the way, members stopped seeing value or never quite found their footing in your community. Reach out personally to members who cancel, even if it’s just to ask what didn’t land. Add an exit survey to uncover patterns. Then, test reactivation offers: a free month, an invite back, or an updated experience. Sometimes, just being seen or heard is enough to bring someone back.
If your MRR is flat…
Look at expanding the value for your existing members. Selling to someone already in your community is far easier than acquiring someone new. Think about layered offers like mastermind groups, premium content, or group coaching. If your core offering is solid, many members will happily pay more for deeper access or transformation.
If posts by members are low…
It’s usually a prompting problem, not a people problem. Most members want to contribute—they just need a nudge. Try seeding your space with great starter questions, like “What’s something that helped you this week?” or “What’s a challenge you’re working through right now?” You can also tag members to share wins or start themed discussion days.
Another helpful tactic is setting a regular cadence for engagement, such as weekly prompts or spotlight threads, and clearly defining your community structure so members know exactly where to post.
How Circle’s analytics help community builders succeed
Once you start tracking your metrics, you need a simple, reliable way to view and act on them. That’s exactly what Circle’s analytics hub was built for.
One central dashboard, all your key metrics
Get instant visibility into your daily and monthly active users, event RSVPs, post volume, and member growth without ever leaving your community platform.
Beyond the basic analytics, you can also:
- Use the “Popular day & time” view (last 90 days) to schedule live events when your members are most active
- Track Activity Score to monitor community health at a glance
- Pull insights from the posts & comments sections to surface top-performing discussions—perfect for weekly recaps
Surface the signals that actually matter
See which spaces are thriving, when members are most active, and how engagement lines up with key moments like campaigns or launches. Use filters to drill into behavior by segment, tag, or space to know not just what happened, but why.
Make smarter business decisions
Track your subscription revenue, understand which paywalls are performing best, and explore how your most engaged members behave. Features like the member leaderboard help you identify potential moderators, mentors, or ambassadors who are already showing up for the community.
Learn from what’s working (and what’s not)
Whether you're testing new content, launching events, or optimizing onboarding, with Circle you can see the impact in real time. From understanding event attendance trends to analyzing post types by member role, with Circle, you have the data to iterate faster and scale smarter.
📊 Curiosity is the key to a data-driven community strategy
You don’t need to be a numbers person to build a data-savvy community. What you do need is curiosity.
- Curiosity about what your members respond to.
- Curiosity about what keeps them coming back—or quietly slipping away.
- Curiosity about what your community could become with the right insight at the right time.
The best community strategies don’t start with data. They start with a question. The metrics just help you find the answers—and keep asking better ones.
If you’re looking for a community platform with robust analytics features to help you grow a stronger, more intentional community, check out Circle.
FAQs about community analytics, metrics, KPIs, and more
What are the most important community metrics?
The most important metrics depend on your goals, but generally: Monthly active users (MAU), churn rate, engagement rate, and percentage of posts created by members. These help you understand whether people are showing up regularly, participating meaningfully, and sticking around, which are key indicators of a thriving, sustainable community.
How can I measure community engagement effectively?
Track a mix of quantitative and behavioral signals. To begin with, look at daily, weekly, and monthly active users (DAU/WAU/MAU) to see how often members are coming back. Then look at posts and comments per member to understand how actively they’re contributing. It’s also worth tracking event attendance and response times—they tell you how involved your members feel and how supported they are.
What’s a good benchmark for community churn?
A churn rate below 5% per month is considered healthy, and under 2.5% is excellent. Rates over 15% are a red flag and suggest you may need to revisit onboarding, member experience, or ongoing value delivery. While some churn is natural, high churn usually points to deeper problems in clarity, positioning, and member fit.
How often should I review community metrics?
Ideally, review your core metrics weekly, especially if your community is active or growing quickly. This helps you stay close to member behavior and catch shifts early. In conjunction, you should also do a deeper monthly review to spot trends and decide what to optimize or test next.